

Bitcoin has faced renewed volatility since late May, with the market retracing from recent highs and injecting a fresh dose of uncertainty across the board. While price action has cooled, BTC continues to hold above key levels that bulls are watching closely. The broader sentiment remains fragile, and many investors are on edge, unsure if this is a healthy pause or a setup for deeper downside.
Analysts are calling for a decisive move above the all-time high to confirm trend continuation, but so far, momentum remains limited. The risk of a further decline still hangs over the market, especially with macro headwinds unresolved and liquidity tight.
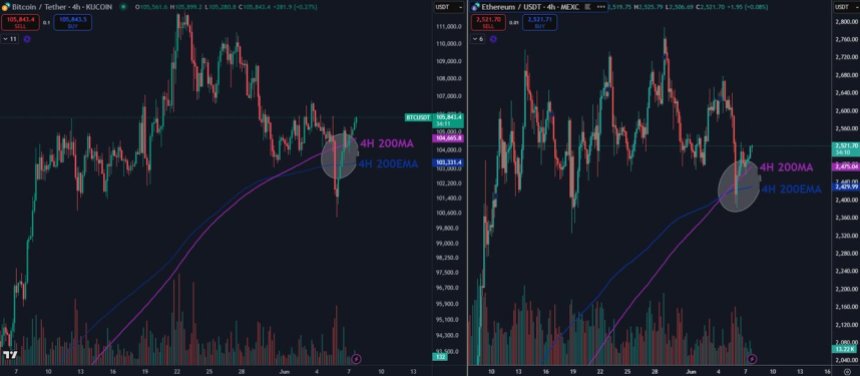
Top analyst Daan shared a timely technical update, highlighting that both Bitcoin and Ethereum have tested their respective 4-hour 200MA and EMA and bounced. These moving averages are closely watched for short-term trend shifts. The fact that both assets respected them as support could be a subtle but important signal. Still, this bounce needs follow-through. Without a strong push higher, traders may lose conviction, and the window for reclaiming bullish momentum could narrow quickly in the days ahead.
Bitcoin Outperforms But Market Risks Loom
Bitcoin continues to trade in a tight range just below its all-time high, struggling to break out with conviction but showing clear resilience. Despite repeated attempts from bears, BTC has held above the critical $100,000 psychological level — a key sign of strength as many altcoins lag behind or lose momentum. While some traders remain cautious, Bitcoin’s relative outperformance is beginning to stand out, hinting at the possibility of a decisive move brewing beneath the surface.
This strength, however, comes amid rising uncertainty in the broader macro environment. The US economy is entering a more fragile phase, with tightening credit conditions, stubborn inflation, and weakening labor data adding pressure. These developments raise the stakes for risk assets, including Bitcoin, which has historically thrived during expansionary periods but often struggles when liquidity tightens.
Daan shared a critical technical update that could help map Bitcoin’s short- and mid-term direction. According to his analysis, both BTC and ETH recently tested their respective 4-hour 200 moving averages (MA) and exponential moving averages (EMA), and successfully bounced from those levels. These indicators are often seen as key dynamic supports during trend formation. If price continues to hold above them, bulls remain in control. But if these levels give way, momentum could flip quickly, opening the door to deeper retracements.
For now, the structure still favors the bulls, but the margin for error is shrinking. With Bitcoin holding steady while macro conditions wobble, the next move could set the tone for the rest of the summer. Traders and long-term holders alike should keep an eye on how BTC reacts to these key support zones in the coming days.
Bulls Reclaim Key Levels
Bitcoin is showing signs of recovery after bouncing from the $103,600 support zone, as seen in the 4-hour chart. The recent drop to this level was met with strong buying interest, triggering a swift rebound. Price is now consolidating around $105,600, having reclaimed both the 200 EMA ($104,924) and the 200 SMA ($104,816), which had previously acted as dynamic resistance during the pullback. This reclaim is a notable technical development and suggests bulls are regaining short-term control.
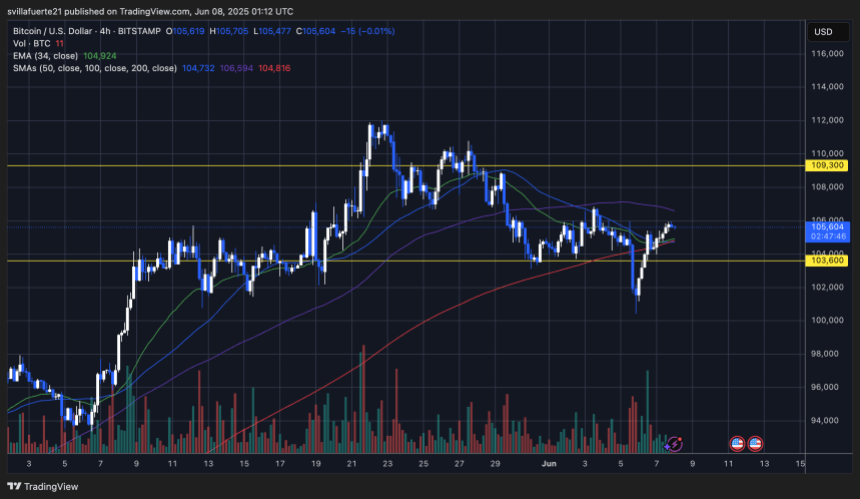
Volume spikes during the bounce add weight to the move, while shorter-term moving averages like the 34 EMA and 50 SMA are now sloping upward, further supporting the bullish case. Still, BTC must break decisively above $106,600 — a recent lower high — to confirm a shift in trend structure.
Above that, the $109,300 resistance stands as the final barrier before retesting all-time highs. On the downside, holding $103,600 remains critical. Losing that level would invalidate the current bounce and open the door to a deeper correction below $100,000.
Featured image from Dall-E, chart from TradingView