

The on-chain analytics firm Glassnode has revealed Bitcoin has recently been trading within a short-term band that has its upper level currently located at $117,000.
Bitcoin Is Trading Between These Two Short-Term Holder Price Bands
In a new post on X, Glassnode has discussed about the short-term price band that Bitcoin has been trading inside lately. The band in question is based on two levels relevant to the short-term holders (STHs), investors who purchased their coins within the past 155 days.
The indicator related to the STHs that’s of interest here is the Realized Price, which keeps track of the average cost basis or acquisition level of the BTC addresses belonging to the group.
When the value of this metric is greater than the asset’s spot price, it means the STHs as a whole can be considered to be in a state of net unrealized profit. On the other hand, it being under the coin’s value suggests the dominance of loss among this cohort.
Now, here is the chart shared by Glassnode, which shows the trend in the STH Realized Price and a few lines corresponding to different standard deviations (SDs) from it:
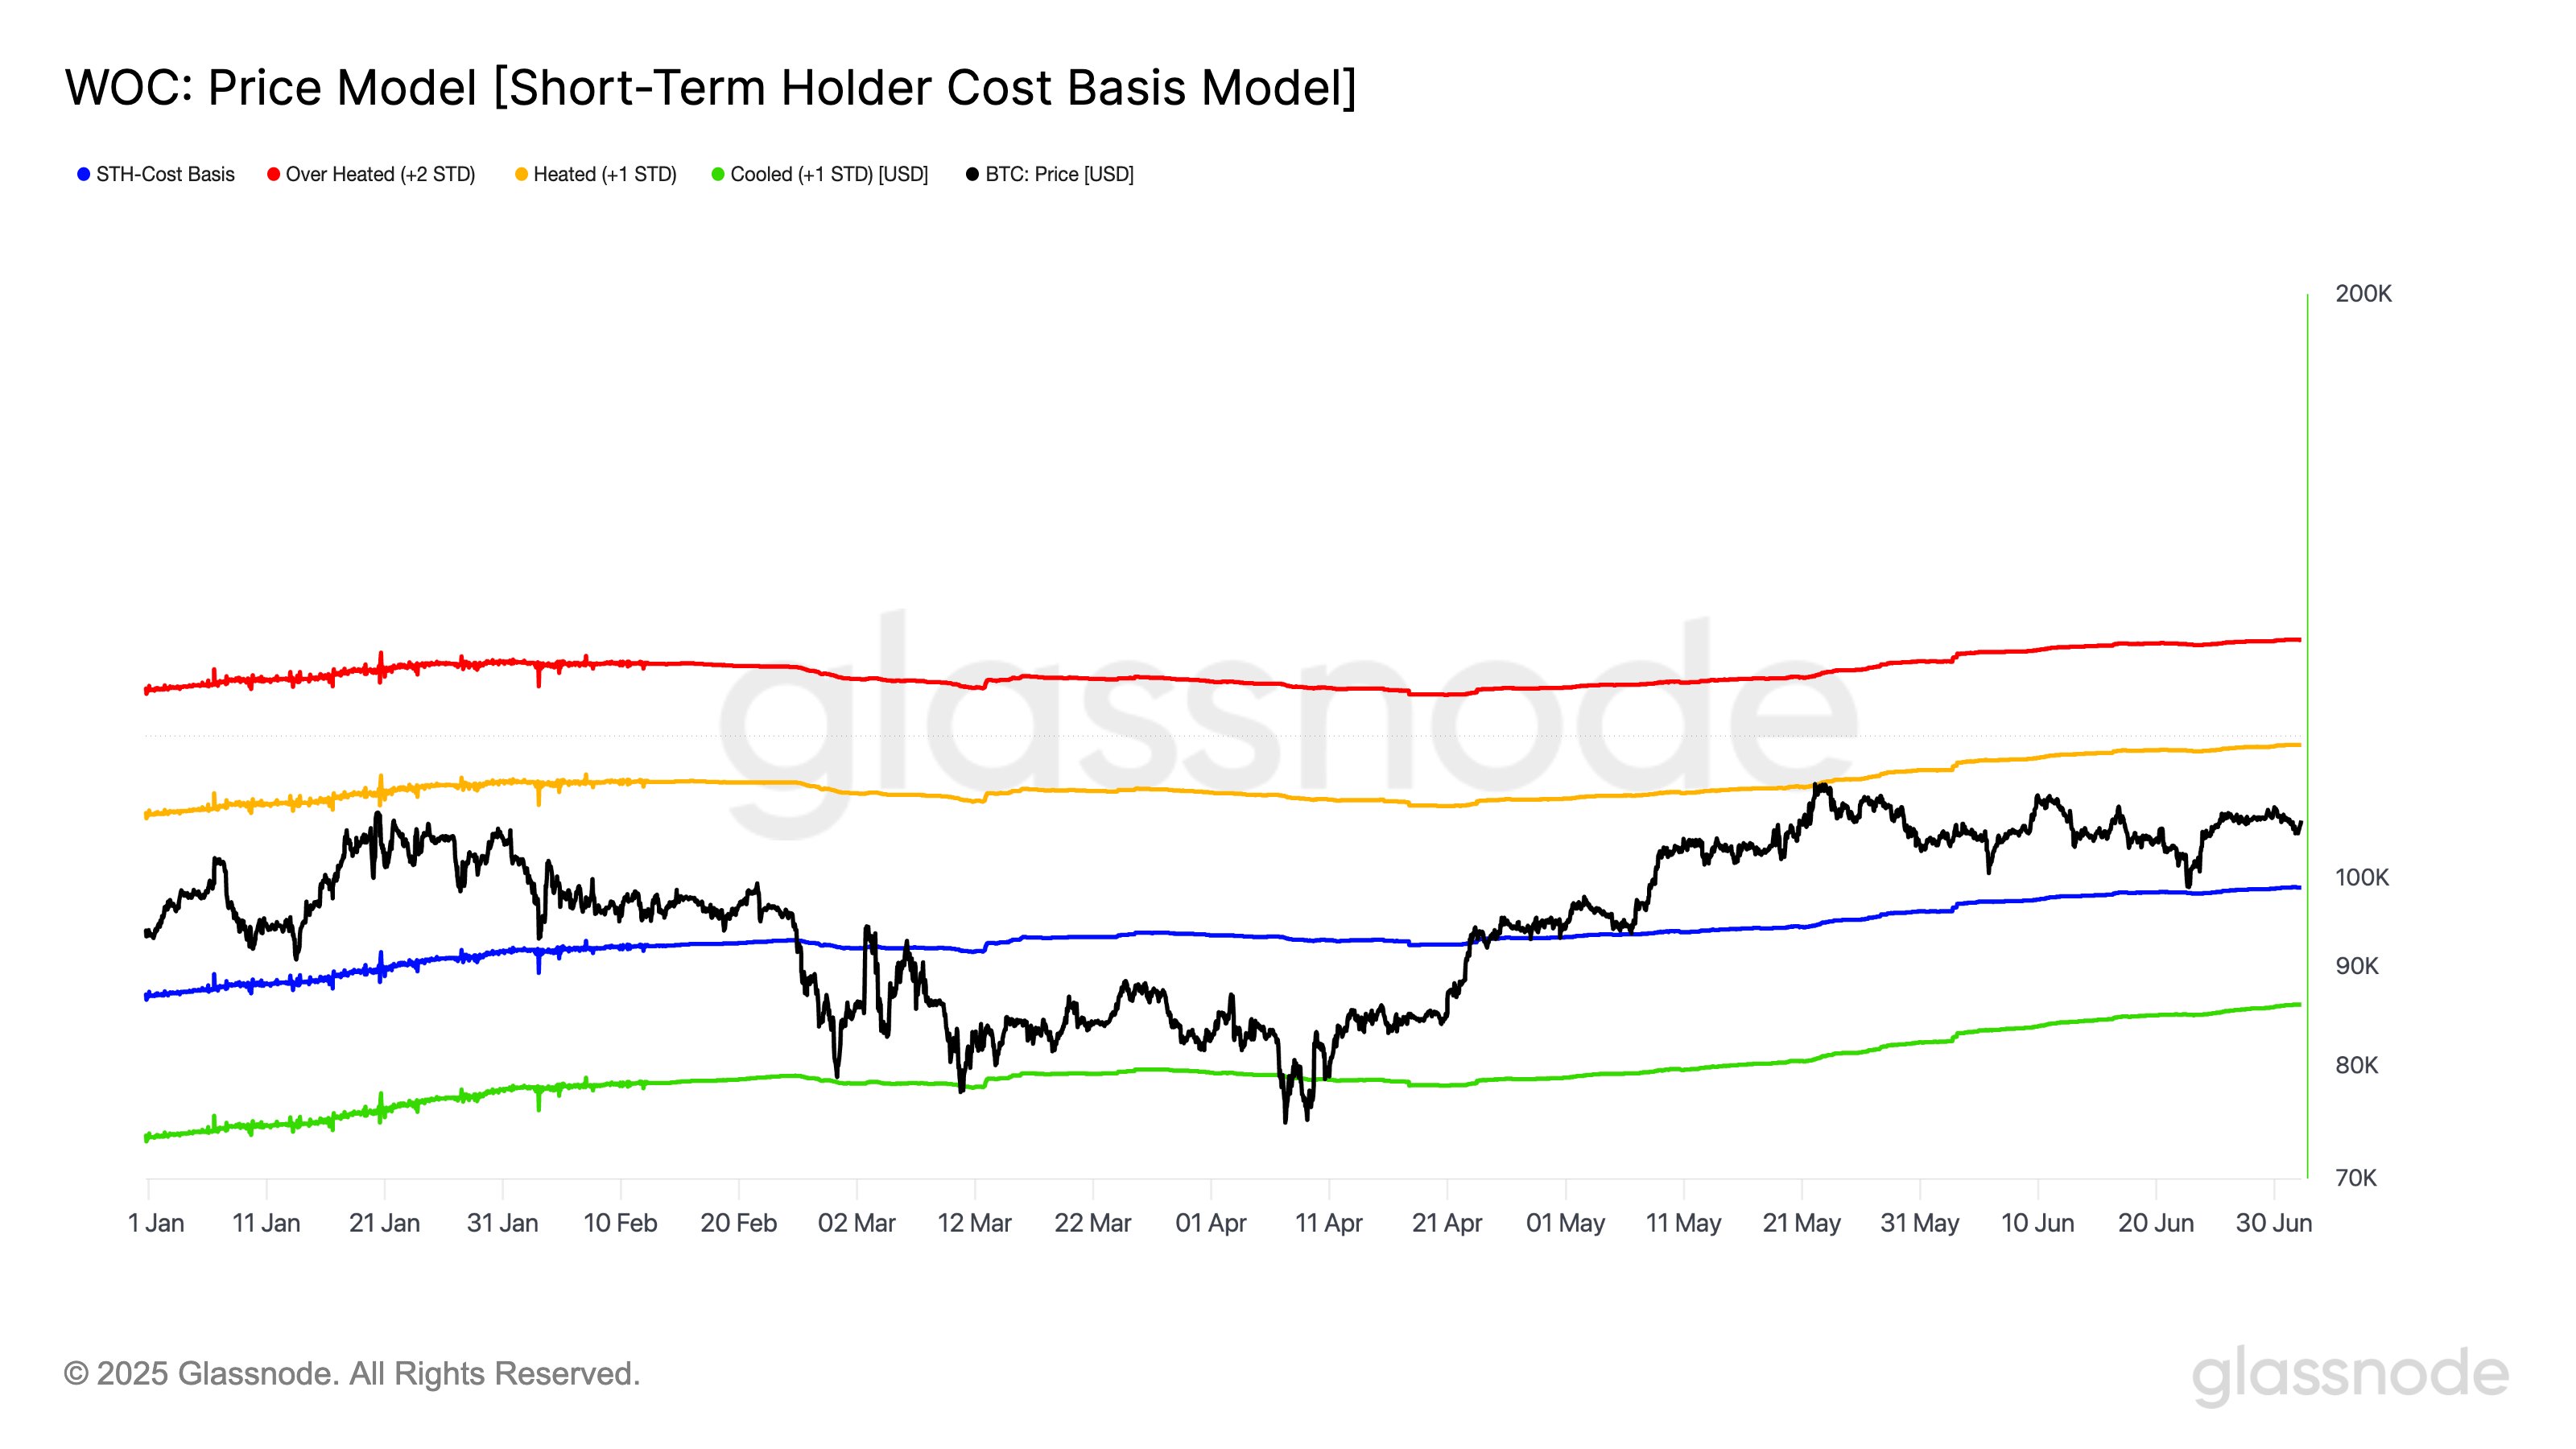
As displayed in the above graph, the Bitcoin price has interestingly traded in a range defined by two of these lines over the last six months. The lower bound of the range has been the -1 SD and the upper one the +1 SD.
The STHs are made up of the new entrants into the sector and fickle-minded traders, so the group tends to easily react to happenings in the market. As such, the cryptocurrency’s price can have some interactions with the STH Realized Price, due to the cohort’s panic buying/selling.
From the chart, it’s apparent that the same has been true in this period of consolidation as well. While the indicator has certainly not acted as an absolute support or resistance, the asset has still seen such effects around it in the short term.
Currently, Bitcoin is trading above the metric after finding a rebound at it last month. The level ahead of the asset now is the +1 SD. In this period of sideways movement, it has so far only been able to test this line once.
“This level can be seen as the upper band of the short-term price action,” notes the analytics firm. The +1 SD is located at around $117,000 right now. It only remains to be seen whether Bitcoin will test this level in the near future or not.
BTC Price
Bitcoin has enjoyed a surge of more than 3% over the past day that has taken its price to $109,500.