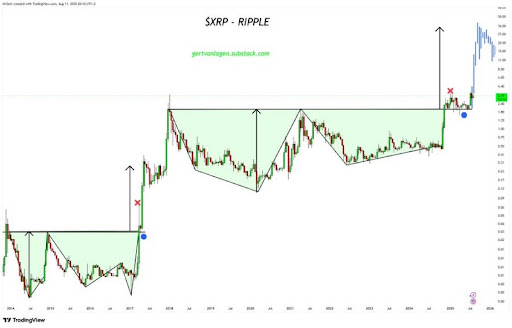
The XRP price has broken out of a 7-year Double Bottom pattern, signaling what analysts predict could be the start of a major long-term rally. According to reports, a breakout and successful retest of this long-standing chart pattern could set the stage for a massive surge toward $36, ultimately repeating the bull rally seen during the 2014-2017 cycle.
XRP Price Eyes $36 After Double Bottom Breakout
Crypto analyst Gert van Lagen has drawn attention to a rare and potentially explosive technical event currently unfolding on the two-week XRP price chart. According to his analysis posted on X social media, XRP has successfully broken out of a massive 7-year Double Bottom formation—a pattern that typically signals long-term reversal from bearish to bullish market conditions.
Based on the analyst’s chart, XRP had breached the neckline of this Double Bottom pattern after years of accumulation, following up its momentum with a textbook retest that confirmed the breakout. This retest, occurring at a critical price point, has historically acted as the final validation before a sustained rally. Lagen has also compared the current cycle with that of the 2014-2017 phase, indicating that XRP’s price action could be repeating similar strong bullish patterns that emerged during that period.

The chart suggests that XRP is poised to clear its former all-time high of $3.84, potentially removing one of the most significant technical barriers in its history. With the resistance level now flipped into support, Lagen’s price projection points to an initial target of approximately $36. This level aligns with the 2.00 Fibonacci Extension of the Double Bottom pattern.
Notably, the expert’s analysis implies that XRP’s current momentum is not just a short-term spike, but likely the early stages of a multi-month, possibly multi-year climb. If the structure follows past patterns and continues to play out as Lagen predicts, XRP could be on track to deliver one of its strongest bull runs since the 2017 rally.
XRP Mirrors Ethereum’s 2017 Breakout Pattern
In a separate bullish analysis, a crypto analyst identified as ‘Shibo’ on X compared XRP’s present market behavior to Ethereum’s historic breakout in 2017. His side-by-side chart shows an almost identical technical progression involving an extended consolidation phase forming a base, followed by a decisive breakout at a clearly defined resistance level.
In Ethereum’s case, this move triggered an extraordinary rally from sub-$20 levels to more than $1,400 in under twelve months, marking one of the most explosive advances in crypto history. Shibo argues that XRP is now positioned in the same “breakout zone” that the ETH price occupied before its parabolic surge.
Based on this chart historical pattern, the analyst has forecasted a rather ambitious price target for XRP. He believes that the cryptocurrency could see a massive surge to $589, representing an eye-watering increase of 18,084%.

