

Bitcoin is testing uncharted territory after breaking past its previous all-time high of $112,000 last Thursday, igniting a powerful new phase in the bull market. With the price currently hovering above $117,000, bulls are firmly in control as optimism spreads across the crypto market. The breakout comes after weeks of tight consolidation, signaling renewed confidence among investors and traders.
On-chain data from CryptoQuant adds further support to the bullish narrative. The Coin Days Destroyed (CDD) metric—used to assess whether long-term holders are selling—has returned to a relatively low average despite the rise in price. This suggests that experienced holders are not offloading their positions, but instead continuing to hold through the rally.
With long-term holders largely inactive and momentum accelerating, Bitcoin appears to be entering a decisive phase. As macroeconomic conditions remain favorable for risk assets, and with institutional demand rising, all eyes are now on how BTC behaves at these new highs—and whether the rest of the crypto market will follow its lead.
Bitcoin Prepares For A Massive Surge
Bitcoin continues to trade above key psychological and technical levels, signaling that the market is entering an expansion phase with the potential for a massive surge. After clearing its previous all-time high and consolidating around $117,000, Bitcoin’s structure looks increasingly bullish. Analysts and traders are closely watching on-chain indicators to confirm whether long-term holders are beginning to exit, but so far, the data suggests they are not.
Top analyst Darkfost shared relevant insights regarding the Coin Days Destroyed (CDD) metric, a key tool used to assess long-term holder activity. CDD calculates how long a Bitcoin stays unmoved before a transfer, revealing long-term participants’ behavior. Recently, the metric saw a sharp spike, raising initial concerns about possible distribution. However, it was later confirmed that the move involved 80,000 BTC in an internal transfer — no actual selling occurred.
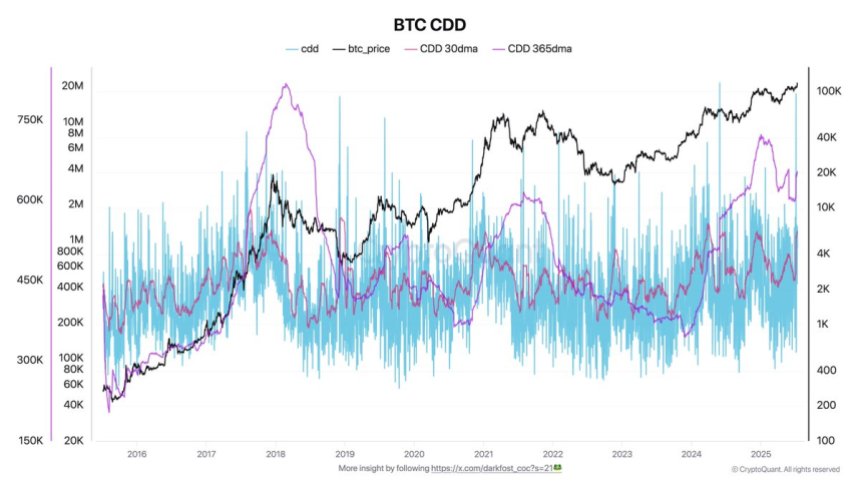
Since that event, the CDD has returned to its previous low range, especially when compared to Bitcoin’s soaring price. This signals that long-term holders are still sitting tight, showing no urgency to sell into strength. Their conviction reflects growing expectations of higher prices ahead, supported by macro conditions, increasing adoption, and rising institutional interest.
With strong hands holding firm and momentum building, Bitcoin appears poised for continuation. As long as key support levels are maintained and long-term holders remain inactive, the setup favors an explosive move that could redefine price discovery in this cycle.
Price Discovery Kicks In: Momentum Accelerates
Bitcoin’s three‑day chart shows a textbook breakout from eight weeks of compression. Thursday’s candle closed firmly above the former record cluster at $109,300, opening the door for a vertical push that carried price to $118,800 on the very next print. The candle body towers well above the 50‑period SMA, while the 100‑ and 200‑period averages slope higher beneath, confirming a bullish long‑term structure.
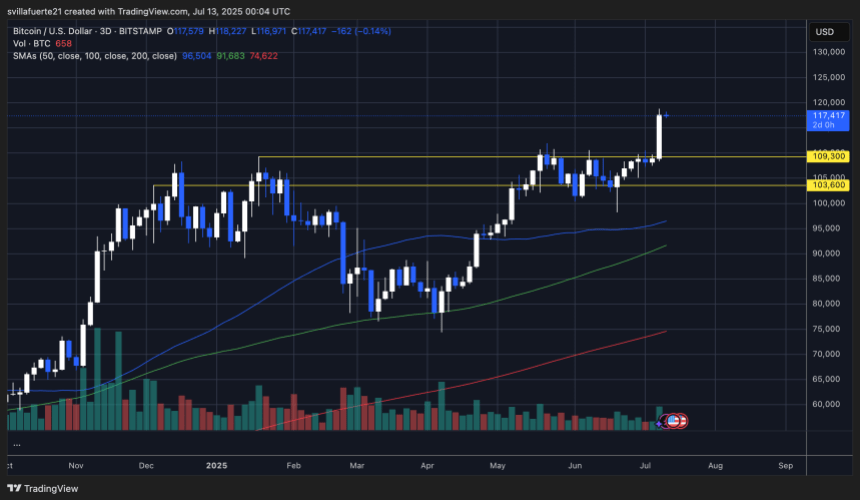
The old resistance band between $105,000 and $109,300 now flips into first demand; any orderly retest that wicks into that zone would likely attract sidelined buyers. Below it, $103,600—the mid‑range support that capped drawdowns all spring—remains the line in the sand for the current trend.
Upside projections derive from the height of the year‑long range (~$15 k). Adding that measure to the breakout point targets $124–125 k as the next logical objective, with the psychological $120 k round number a potential interim stall area. Momentum oscillators on medium time‑frames are stretched but not at extreme levels, suggesting room for continuation before a cooling period becomes necessary.
Featured image from Dall-E, chart from TradingView