

Bitcoin is showing signs of calm after a wild ride earlier this year. The top cryptocurrency dropped sharply from a high of $109,000 in January to a low of $74,600 by mid-April. That’s more than $34,000 wiped out in just a few months.
But things have shifted since then. Bitcoin climbed back, gaining over 30% and recently reaching $105,700. It’s been trading quietly between $101,000 and $104,000 over the past week.
$10,000 Steps Keep Adding Up
Some traders are starting to notice a pattern. According to analyst Trader Tardigrade, Bitcoin has been rising in $10,000 chunks, then taking short breaks. He pointed out moves from $75,000 to $85,000, then to $95,000, and again to $105,000. Each jump is followed by seven to 10 days of sideways action.
#Bitcoin is climbing steadily, with intervals of around 10k in each consolidation
$BTC pic.twitter.com/stEgE5NkQH
— Trader Tardigrade (@TATrader_Alan) May 16, 2025

This stair-step pattern isn’t just a lucky guess. It gives traders a chance to breathe, take profits, or set new entries. These pauses can also turn into support zones—levels where buyers step in again. If the same behavior continues, the next target could be $115,000, which is about an 11% jump from where Bitcoin is now.
Price Holding Above $100K Gives Bulls Confidence
Trading above $100,000 is no small feat. Holding that level gives Bitcoin some strength and psychological support. The more time it spends above this line, the more likely buyers feel safe to enter. Last week’s move was modest, only about a 0.50% gain, but that followed a strong 11% surge earlier in May.
Some market watchers think this slow and steady growth is a healthy sign. Instead of wild swings, Bitcoin is showing more controlled movement. It’s building a base, and that can be a setup for something bigger down the road.
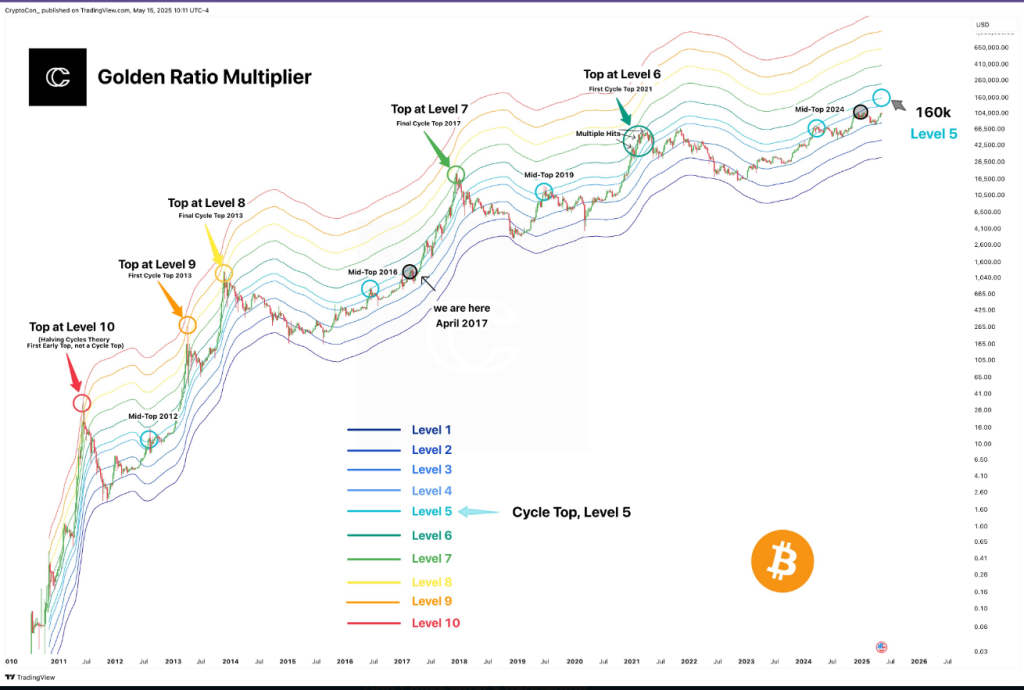
The Golden Ratio Multiplier was one of the few metrics to be accurate in real time at the April 2021 Bitcoin Cycle Top.
We’ve already hit our cycle top level this cycle once, but this was for the cycle mid-top in March 2024, which means we’re bound to do it again.
Level 5 is… pic.twitter.com/wEHOI6L5Tm
— CryptoCon (@CryptoCon_) May 15, 2025
Long-Term Model Points Toward $160K
Beyond the short-term moves, a few analysts are looking much higher. CryptoCon, who follows long-term cycle models, shared that Bitcoin may be in the middle of a buildup.
He referenced the Golden Ratio Multiplier, a model that uses Fibonacci levels and long-term averages. According to him, a major cycle level was already hit in March 2024, but that wasn’t the final top.
His forecast puts the next ceiling near $160,000, a level he calls “Level 5” in the cycle. That would be a big leap from today’s price—over 50% higher.
He compared today’s market to what happened between 2015 and 2017, when a long stretch of slow growth led to a fast rally.
Featured image from Unsplash, chart from TradingView