
In a fresh 12-hour chart shared on X, independent technician Cantonese Cat (@cantonmeow) underscores what he calls a “Bollinger Band squeeze” on Dogecoin, hinting that volatility could be about to erupt.
Dogecoin Bollinger Bands Hint At ‘Huge Move’
The chart, captured at 03:54 UTC on May 21, fixes the memecoin at $0.22967 while the 20-period simple moving average (the Bollinger basis) tracks marginally lower at $0.22717. The upper and lower bands are parked at $0.24260 and $0.21175 respectively, compressing the trading envelope to barely three US cents and leaving just a 13.6% gap between the extremes—its tightest spread since early April’s doldrums.
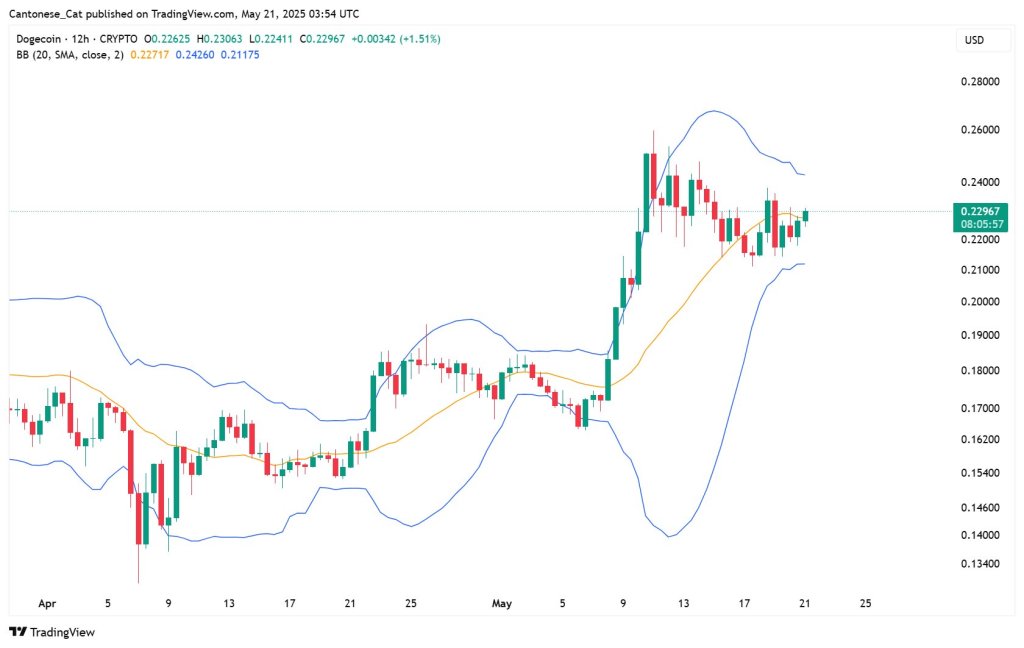
The chart lays out a clear chronology of volatility expansion and subsequent contraction. From May 6 onward Dogecoin erupted out of a month-long base, sprinting from the mid-$0.16 zone to print a local peak roughly at $0.26. That impulse detonated the bands to their widest reading in six weeks. Since then, the DOGE price has traced a shallow pull-back but—importantly—has not surrendered the 20-SMA. Each dip into the mid-$0.21 area has been absorbed, carving out progressively higher lows and turning the mid-band into dynamic support.
With the bands now coiling, traders are eyeing the inflection points telegraphed by the indicator. A decisive 12-hour settlement beyond the upper rail at $0.243 would release price into open air, exposing the recent swing high at $0.27 and, beyond that.
Conversely, a candle body punched through the lower rail at $0.212 would nullify the short-term bullish structure and likely drag Dogecoin toward the psychological $0.20 handle and May’s value area near $0.16. Until either threshold gives way, the squeeze itself remains the story. “Bollinger band squeezing, getting ready for the next huge move,” the analyst writes fittingly.
DOGE Channel Breakout Is Brewing
Shifting up to the one-day view, Dogecoin’s action since the November-2024 peak is contained by a broad descending channel whose ceiling now descends through the $0.24 corridor. Price is camped directly beneath that upper rail at $0.231, an area that also coincides almost to the cent with the 61.8% Fibonacci retracement of the full November-high–to–mid-March-low leg ($0.234).
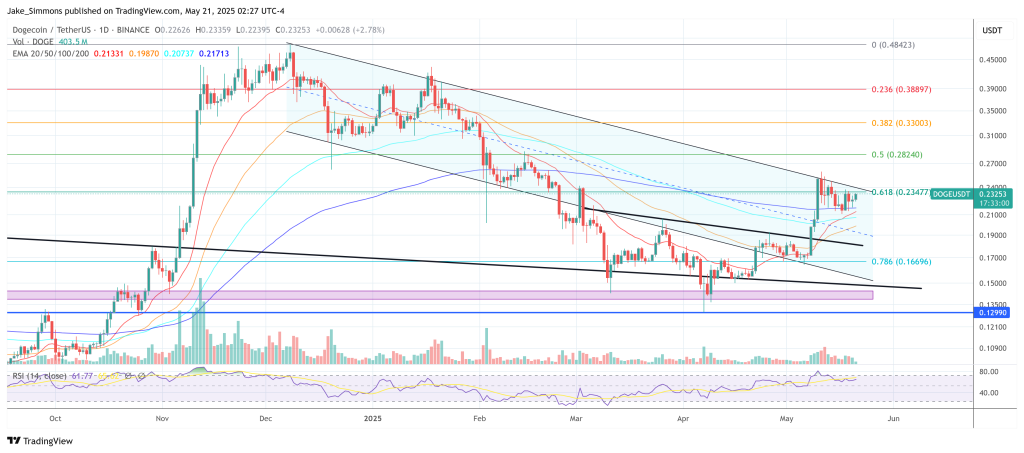
The confluence creates a technically potent lid: a daily close above it would not only mark the first breach of the seven-month channel but would simultaneously reclaim the “golden ratio,” an event that historically invites trend acceleration.
If bulls can force settlement north of the overhead trendline and the 0.618 Fib, the next magnet resides at the 0.5 retracement ($0.2824). Beyond that, the 0.382 level at $0.3300 and the 0.236 at $0.3890 bracket the higher targets inside the channel’s former interior.
Failure here would leave a well-defined support ladder: the 200-day EMA at $0.217, the 100-day at $0.207, and the cluster around the 0.786 Fib at $0.1669. Only a decisive break of those shelves would re-energise bears sufficient to revisit the March capitulation trough at $0.13.