

Dogecoin is grinding along a technical fault line around the low-$0.10s, with traders flagging a tight support band that could define whether DOGE stabilizes or slips into a structurally weaker regime.
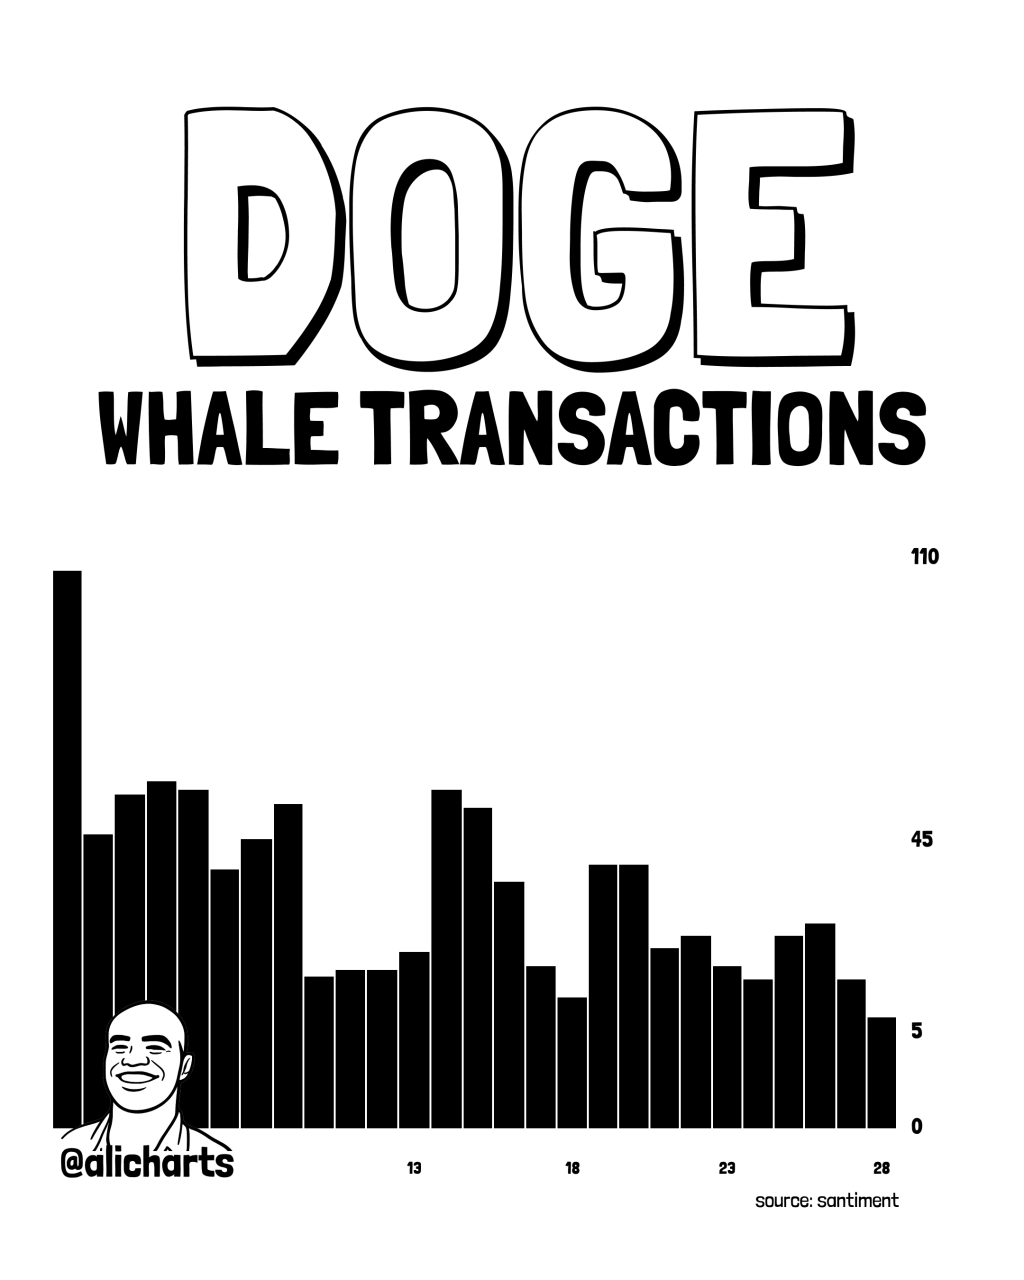
The immediate setup is being framed as a high-conviction “line in the sand” by chart-focused accounts, even as on-chain whale activity appears to be fading fast. Ali Charts said transactions larger than $1 million on the Dogecoin network “dropped by 94.6%, from 109 to just 6, over the past four weeks,” pointing to a sharp pullback in large-ticket activity during the same period DOGE has been probing support.
This Needs To Be The Dogecoin Bottom
Kevin (@Kev_Capital_TA) argued that DOGE is now sitting on top of longer-term trend support that typically draws systematic attention. “You want to see a very important chart? Dogecoin is currently sitting on top of its 2W 200 ema/sma and also a major structured support zone. The .12-.10 zone is everything,” he wrote.
“If there was ever a place you wanted to see a bottom come in it’s in that zone otherwise things get structurally very dangerous. Performance will be completely BTC dependent as usual.”
That framing matters because it ties the trade to two separate conditions: DOGE holding a defined price shelf, and Bitcoin avoiding a broader risk-off move that could force correlation trades to unwind. In other words, even a “clean” DOGE level may not hold in isolation if BTC breaks lower.
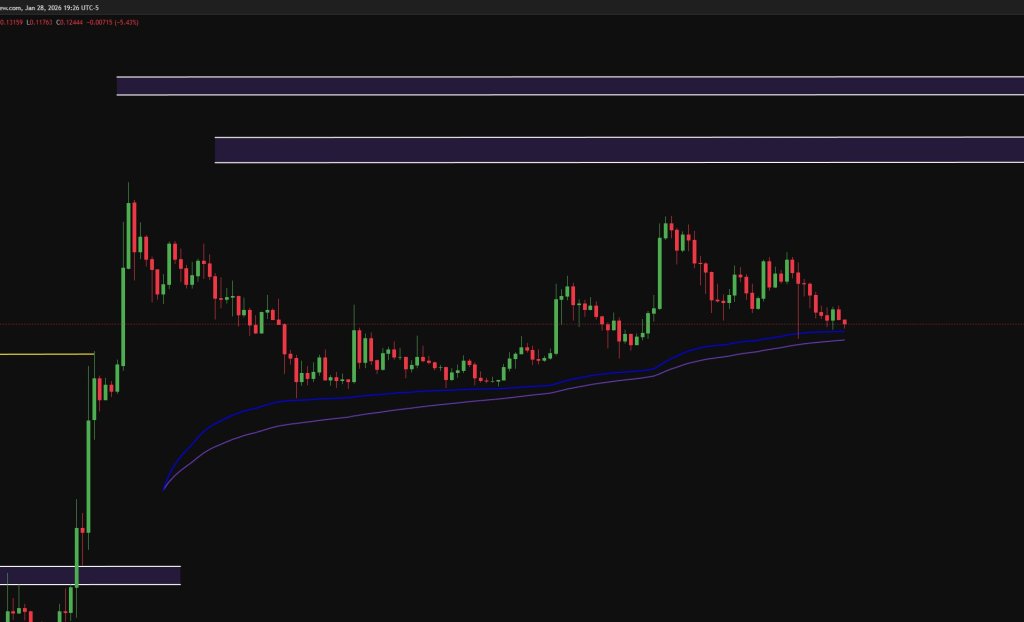
Shorter-term charts shared by Cantonese Cat (@cantonmeow) lean into the same battleground. Posting a 4-hour Bollinger Band view, the account highlighted a push through local levels into what it described as a buy-side zone: “Piercing through into buy order block below on low volume,” Cantonese Cat wrote today, adding, “Think I’m gonna buy some DOGE tonight.”
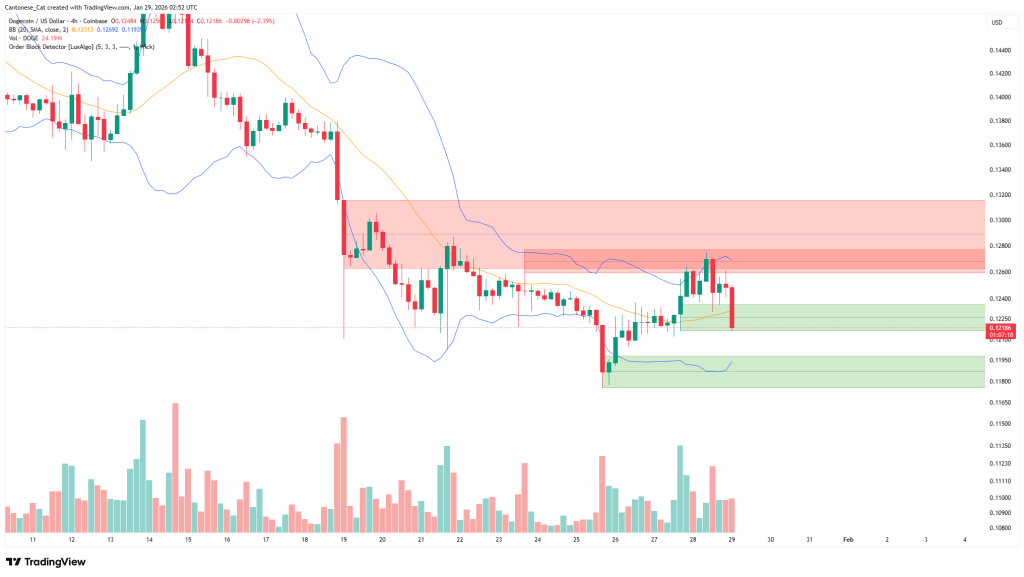
The chart shows DOGE falling below the 4-hour Bollinger Band midline. Thus, price could drift back toward the lower band near $0.12, an area that overlaps with the support zone Kevin flagged. A clean break below that cluster would shift the setup from “defending support” to “risk of continuation lower,” putting deeper downside back on the table.
Cantonese Cat also posted a DOGE-versus-DXY macro comparison on Jan. 28, suggesting the broader backdrop could still support a reflexive move higher if conditions line up. “Macroenvironment favors DOGE to run up,” the account wrote. “So either DOGE doesn’t ever run up again because it doesn’t have utility, or that history will repeat itself.”
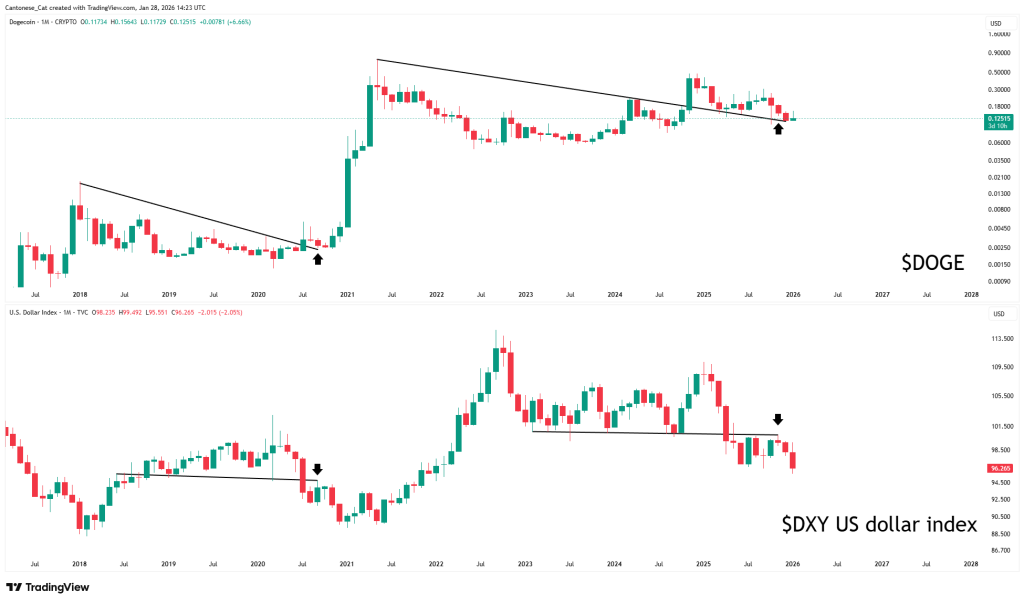
It’s a stark binary, but it captures the tension DOGE traders are navigating: meme coins can trade as pure liquidity beta when macro conditions loosen, yet the market can also punish assets that struggle to sustain fresh demand once the speculative impulse fades.
The next move is likely to be dictated by whether DOGE can defend the $0.10–$0.12 band while participation returns, either through renewed large-holder flows or broader risk appetite led by BTC. If that floor holds, traders are positioning for a bottoming process and a squeeze back into overhead supply.
At press time, DOGE traded at $0.121.
