

ONDO is under pressure after a sharp 33% decline from its May highs, reflecting growing uncertainty and bearish momentum across the market. Once a standout performer, the token has lost steam as sentiment shifts and price action turns decisively negative. While some traders are still watching for potential rebounds, many analysts are now calling for a breakdown, warning that the current structure could give way to deeper losses if key support levels fail to hold.
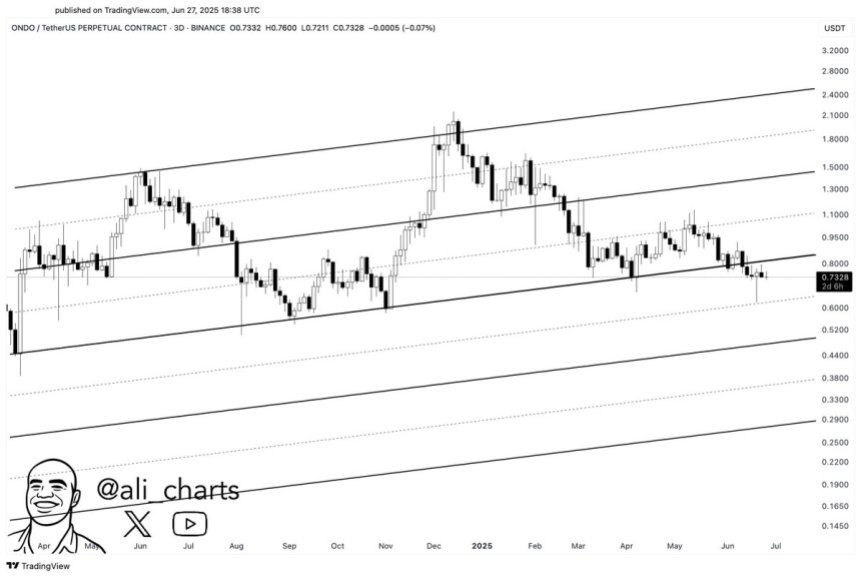
The mood around ONDO remains divided. Some investors view the dip as a healthy retrace in a broader uptrend, while others see it as the start of a more extended correction. Top analyst Ali Martinez has added to the cautious outlook, noting that ONDO is breaking out of an ascending channel to the downside—an often bearish signal. This pattern suggests that momentum is weakening and that the token could soon test lower demand zones.
With ONDO hovering near key technical levels and volume thinning, the coming days will be critical. If the breakdown continues, the price could revisit earlier consolidation areas. For now, bearish pressure dominates, and bulls must defend support convincingly to prevent further downside.
Bulls Struggle To Hold Structure As Risks Grow
As the broader altcoin market braces for a decisive move, ONDO remains trapped in a bearish structure, unable to establish clear demand. Bulls have struggled to reclaim momentum or push price above critical supply zones needed to maintain the long-term uptrend. With sellers dominating and key support levels under pressure, ONDO’s technical structure appears fragile.
Despite recent weakness, some market participants remain cautiously optimistic about ONDO’s longer-term potential. Macro narratives around real-world asset tokenization continue to support fundamental interest, but short-term price action remains a challenge. The inability to hold above prior consolidation ranges suggests that buyers are not yet stepping in with enough conviction to flip the trend.
Ali Martinez has raised alarms by highlighting a concerning technical development: ONDO is breaking out of an ascending channel—this time to the downside. Historically, this pattern signals a shift in market structure and sets the stage for more aggressive downside moves. Martinez’s outlook points to a potential slide toward the $0.29 level, which would mark a significant breakdown from current prices.
For now, ONDO trades in a vulnerable position. If bulls fail to reclaim higher levels and restore momentum, the altcoin risks accelerating its decline. However, if sentiment shifts and broader market strength returns, ONDO could still recover in the coming months.
ONDO Breaks Below Moving Averages As Bearish Momentum Builds
ONDO is trading at $0.747 after failing to hold above key moving averages, with both the 50-day ($0.93) and 200-day ($1.00) simple moving averages now acting as overhead resistance. The current price structure on the 3-day chart shows a consistent downtrend, with lower highs and lower lows forming since the March peak. Price has now broken below the prior consolidation zone, signaling growing bearish momentum.
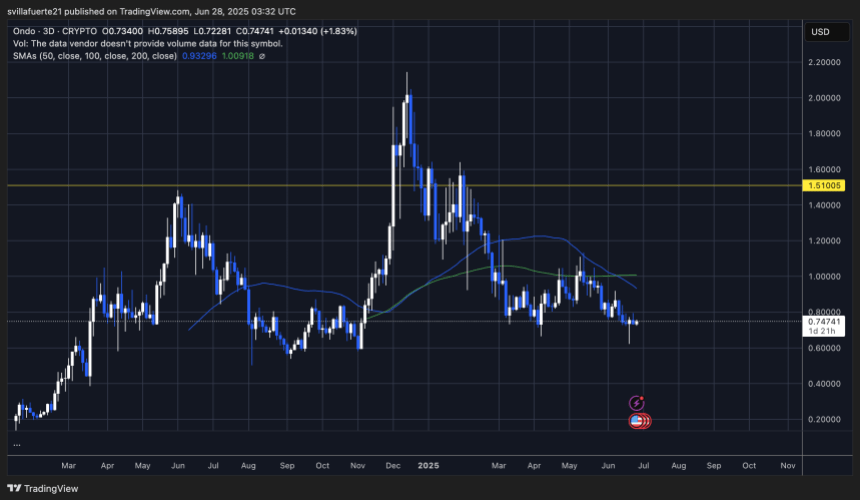
The rejection from the $1.00 psychological level earlier this quarter added to downward pressure, and the break of the $0.80 level confirms that bulls are losing control of short-term structure. If ONDO continues to trade below both moving averages, it may struggle to find solid demand in the near term.
Key historical resistance remains at $1.51, but with ONDO currently 50% below that level and forming a bearish structure, downside risk continues to dominate. A breakdown below $0.70 could accelerate the fall, potentially targeting the $0.60–$0.50 range where previous demand clusters formed in late 2023.
For bulls to regain momentum, ONDO must reclaim the 50-day SMA and close above $0.85. Until then, the chart favors the bears, and the trend suggests caution for long positions.
Featured image from Dall-E, chart from TradingView