

A recent post by crypto analyst Stockmoney Lizards on X suggests that the current Bitcoin structure is giving bears “the perfect opportunity” to short the market down to $40,000. His message was paired with a chart showing Bitcoin falling below an important resistance ever since it broke below $100,000, creating what appears to be a clean continuation setup for traders expecting deeper losses.
However, although the chart highlights a similar bearish structure in 2022, the analysis behind his post points to a more layered interpretation of what may come next for Bitcoin.
The Setup Bears Believe Is Finally Here
In the chart he shared, Stockmoney Lizards showed how Bitcoin’s latest breakdown resembles the 2022 pattern, when the price action rejected a major resistance level and fell sharply into what later became a large accumulation zone. The current structure shows a similar rejection just above the $100,000 zone, followed by a drop below the weekly EMA50. This move has brought Bitcoin into a region that is similar to the range where accumulation formed in the earlier cycle.
An overlay of the new price action on top of the previous one shows the path downward seems almost predetermined, creating the impression that the Bitcoin price is setting up a natural decline to as low as $40,000 in the coming weeks and months. Bitcoin is currently trading at $90,240. A crash to $40,000 would mean wiping out roughly 55% of its value from here, effectively erasing the entire progress it has built over the past two years.
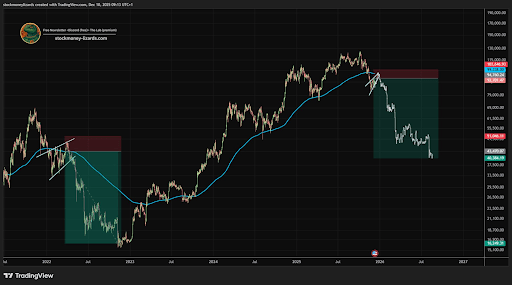
Bitcoin Price Chart. Source: @StockmoneyL On X
Why The Perfect Short Is Not The Analyst’s Real Message
After the post gained traction, Stockmoney Lizards stepped in to clarify that his message had been taken too literally. His invitation for traders to short down to $40,000 was intentionally exaggerated, and the market does not behave this way.
He clarified that he does not foresee a collapse into a deep bear market. Instead, he believes Bitcoin may consolidate, possibly sweep local lows, but not have a prolonged breakdown. Furthermore, he noted that the worst-case scenario would be a touch of the weekly EMA200, and this is not a place where bull markets end. The real midterm prediction is a higher move for the Bitcoin price.
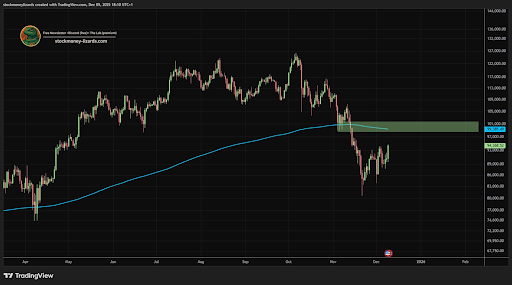
Before posting the supposedly bearish prediction, Stockmoney Lizards had shared another analysis describing Bitcoin as being close to the endboss at the weekly EMA50 indicator.
Bitcoin Price Chart. Source: @StockmoneyL On X
That earlier chart offered a clearer view of his actual stance. In it, he predicted that Bitcoin was approaching a major technical pivot and that he expected upward movement into the end of December and Q1 2025. Therefore, the weekly EMA50 is the barrier that Bitcoin needs to reclaim in order to launch its next phase of bullish momentum.