CrediBULL Crypto (@CredibleCrypto) argues that market structure across three charts—XRP/ETH, XRP/USD and ETH/USD—now tilts in favor of renewed XRP outperformance versus Ethereum.
XRP Ready To Crush Ethereum?
In an update on X, the analyst wrote: “XRP/ETH has hit my downside area of interest (also midrange) after a 3 month correction that followed a 700% rally off of range lows… XRP/USD is now in its 9th month of consolidation above the highest monthly close in its history… ETH/USD is approaching prior ATH after completing a clean 5 wave move off of $2100 and is likely due for some consolidation.” He concluded: “When you put all this together, it suggests we are getting closer to the next period of outperformance on $XRP against $ETH… It’s almost time to zerp it.”
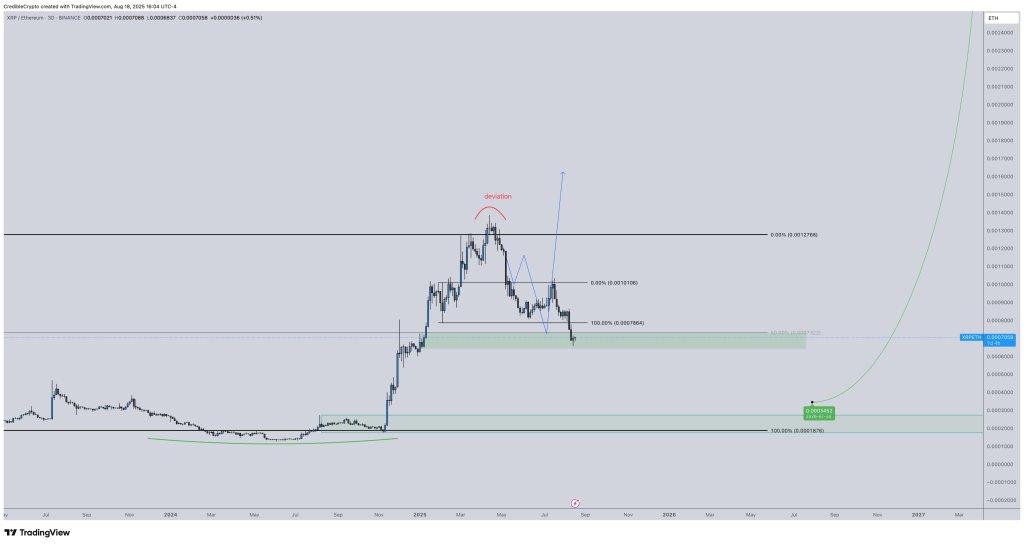
On the XRP/ETH three-day chart, price has retraced to the analyst’s highlighted support cluster that doubles as the midrange of the 2025 advance. The demand band spans roughly 0.0007322–0.00065 ETH per XRP, with the midrange annotated at 0.0007322 and a measured 100% level at 0.0001876.
This test follows a four-month drawdown from a mid-April peak that briefly pushed above resistance—marked on the chart as a “deviation”—before mean-reverting lower. Immediate reference resistances overhead are shown at 0.007864 and at 0.0010106 as well as the larger range cap near 0.0012768. Holding the 0.0007322–0.00065 area would preserve the higher-time-frame uptrend in the ratio and keep a recovery toward the 0.0010–0.00128 region in play.
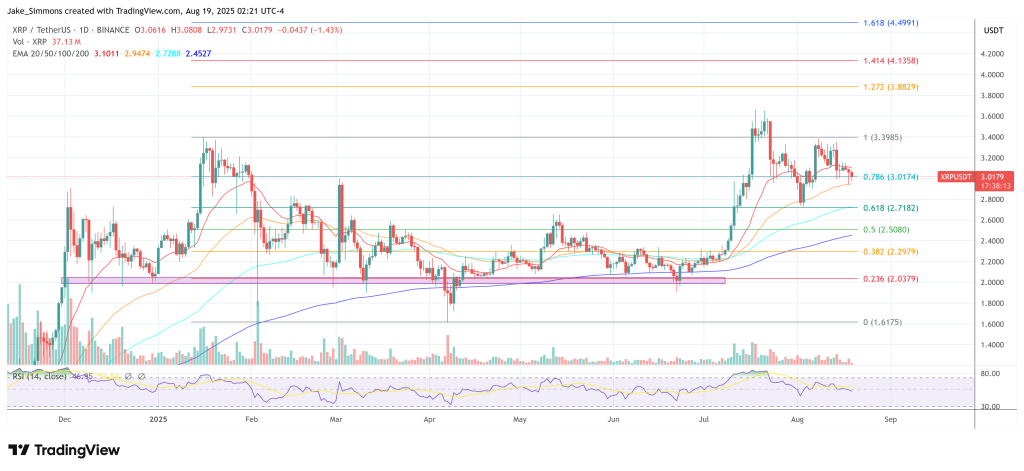
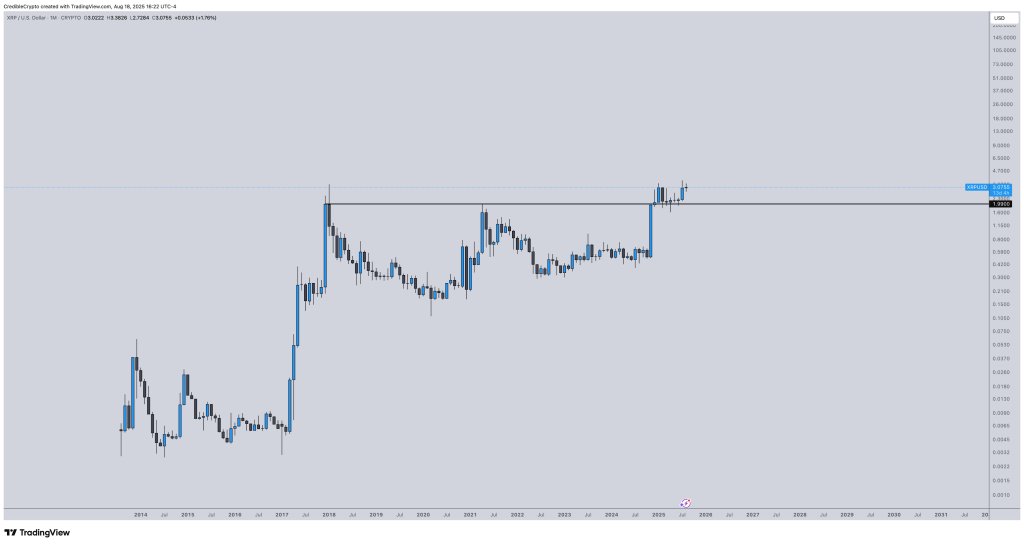
The monthly XRP/USD chart foregrounds duration and positioning. Price has spent nine consecutive months consolidating above the highest monthly close on record, plotted around $1.90. That multi-quarter acceptance above a legacy threshold is the kind of basing behavior often seen before trend continuation in strong cycles. The candles show orderly compression just north of the $1.90 line rather than impulsive rejection back into the prior range, underscoring the idea of digestion rather than distribution.
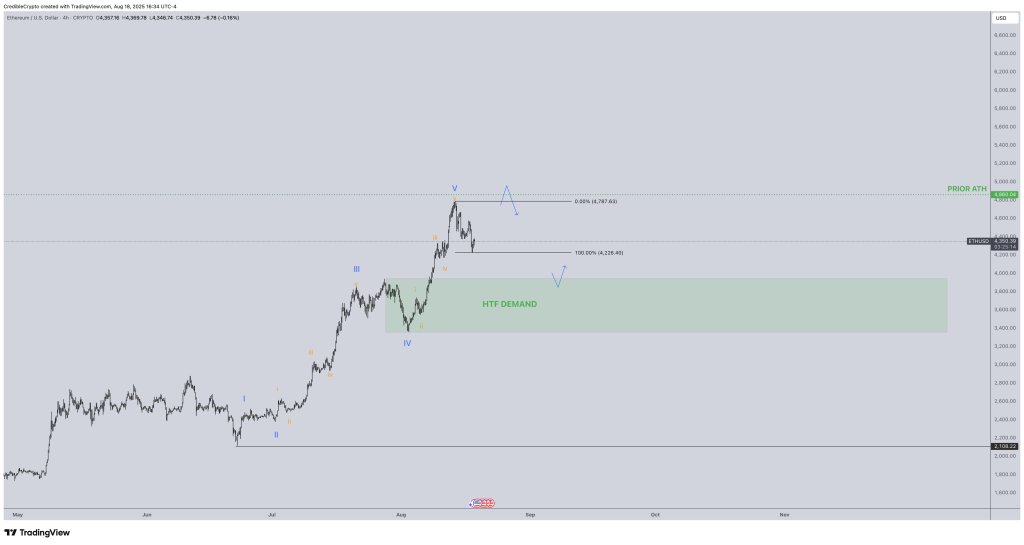
In contrast, the Ethereum 4-hour chart is labeled as a completed five-wave advance from the $2,100 base, with ETH now pressing into the zone beneath its prior all-time high. The chart marks the former peak at $4,880, with a recent high at $4,787, and yesterday’s dip to $4,226.
Beneath the spot, a broad “HTF DEMAND” block is mapped in the mid-$3,000s to just under $4,000. The schematic the analyst draws allows for a final probe toward the $4,780–$4,880 band followed by consolidation or a deeper corrective sweep into that demand region before any higher-time-frame expansion. Put differently, ETH is confronting resistance into prior extremes after a completed impulse, a context that statistically favors time-based digestion or price-based retracement.
Taken together, the cross-pair support on XRP/ETH, the endurance of XRP’s monthly structure above $1.90, and ETH’s proximity to its $4,787–$4,880 prior-high band after a clean five-wave push from $2,100 create a relative-strength setup that skews toward XRP.
If the ratio continues to defend 0.00073–0.00065 and ETH spends time consolidating beneath or around prior ATH—with $4,226 and the mid-$3,000s demand as clear corrective references—the path of least resistance is for the XRP/ETH line to pivot higher toward 0.0010 and potentially the 0.00128 range cap. As the analyst summarized: “XRP may be gearing up for its next impulse while ETH may be cooling off from its last.”
At press time, XRP traded at $3.01.