
XRP is printing its most constructive long-term structure on record, according to independent chartist “The Great Mattsby” (@matthughes13), who points to the three-month Ichimoku system and a year-long base forming above its key quarterly averages.
XRP Is In The Strongest Bull Run Ever
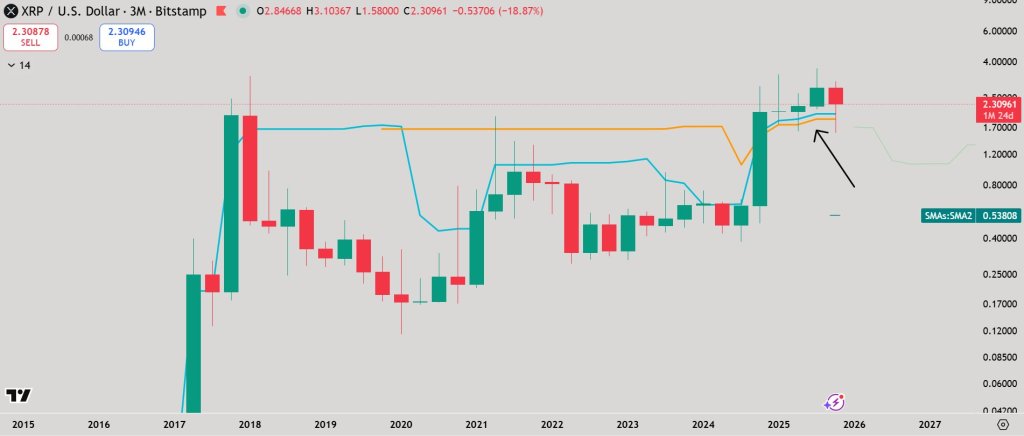
On the latest 3-month XRP/USD chart from Bitstamp, the in-progress candle shows price around $2.31, with the Ichimoku conversion line and baseline tracking just beneath spot. The analyst highlights that XRP “has never built a base above the 3 month conversion or baseline in its history and it’s doing it now for the past year” (posted Nov. 8, 2025).
That observation is notable because, in prior cycles, quarterly closes consistently failed to hold above those Ichimoku reference lines after rallies, whereas the current cycle has seen price stabilize on top of them for multiple quarters in a row. The present quarterly candle remains open, but the configuration—price above both the 3-month conversion and baseline—visually underscores the claim of an ongoing macro bull trend.
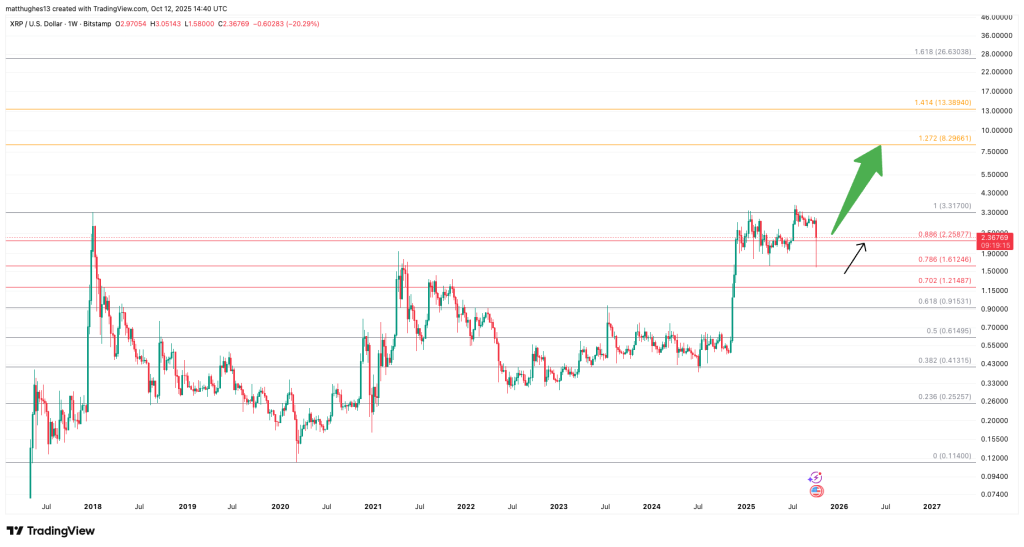
And there’s a more bullish structure for XRP. XRP has been oscillating between the 0.886 Fibonacci retracement at $2.25877 and its 2018 cycle all-time high at $3.31700. Since early December last year, price repeatedly defended the $2.25877 band as support while failing to secure acceptance above the $3.31700 ceiling on the weekly chart, creating a horizontal range capped by the former peak.
“To put things in perspective, XRP has been consolidating between the 0.886 Fibonacci level and its 2018 all-time high (2.25877–3.317). It’s building a strong base above the 0.886 Fib,” Mattsby wrote on Oct. 12, adding that this structure keeps XRP in what he calls a “#Palantiring candidate” posture. Although that remark is four weeks old, the argument remains intact on the posted chart: the 0.886 area continues to function as the pivotal shelf.
XRP Price Targets
Beyond the prior-cycle high, the same weekly framework maps out upside extension levels that would logically come into play only if $3.31700 is reclaimed and held. Those include the 1.272 extension around $8.29661, the 1.414 near $13.38940, and the 1.618 up at $26.63038.
Closer to price, the stacked retracement supports below $2.25877 are clearly demarcated at $1.61246 (0.786), $1.12487 (0.702), $0.91531 (0.618), $0.61495 (0.500), $0.41315 (0.382), and $0.25257 (0.236), delineating the ladder of demand zones that governed XRP’s multi-year range prior to the latest advance.
Taken together, the two timeframes tell a coherent story. On the high-timeframe Ichimoku view, XRP is maintaining altitude above its 3-month conversion and baseline for the first sustained period in its history—an objective sign of trend strength.
On the weekly, price action has compressed into a well-defined band between $2.26 and $3.32, with repeated mean-reversions indicating accumulation rather than distribution while the market tests overhead supply at the 2018 high. As long as the 0.886 retracement at $2.25877 continues to hold on closing bases, the consolidation thesis laid out by The Great Mattsby—and the characterization of this as XRP’s strongest macro bull trend to date on Ichimoku terms—remains technically valid.
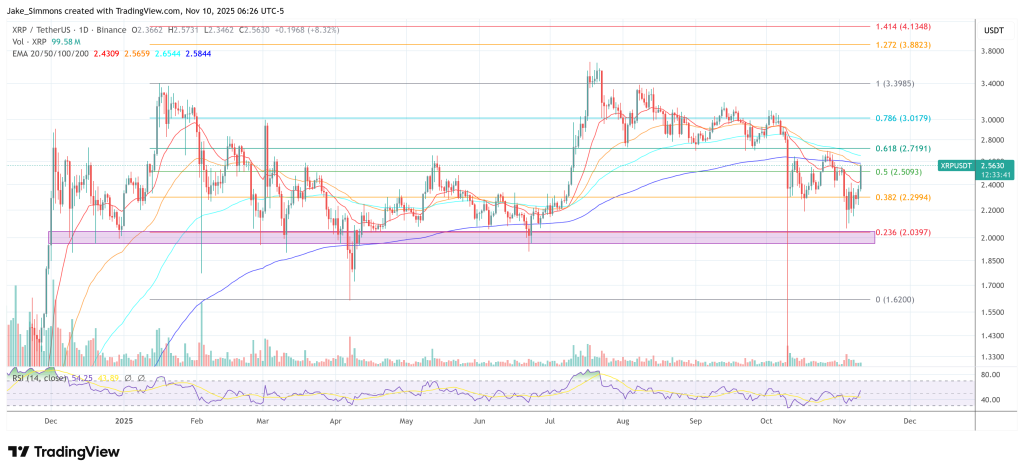
At press time, XRP traded at $2.56.