

XRP price is correcting gains below the $3.25 zone. The price is consolidating and might dip below the $3.080 support zone in the near term.
- XRP price is struggling to settle above the $3.250 zone.
- The price is now trading below $3.250 and the 100-hourly Simple Moving Average.
- There was a break below a key contracting triangle with support at $3.20 on the hourly chart of the XRP/USD pair (data source from Kraken).
- The pair could start another increase if it stays above the $3.080 zone.
XRP Price Approaches Key Support
XRP price formed a base above the $2.920 level and started a fresh increase, like Bitcoin and Ethereum. The price gained pace for a move above the $3.20 and $3.25 resistance levels.
The bulls pumped the price above the $3.320 level before the bears appeared. A high was formed at $3.380 and the price is now correcting gains. There was a move below the $3.250 level. The price dipped below 23.6% Fib retracement level of the upward move from the $2.90 swing low to the $3.380 high.
Besides, there was a break below a key contracting triangle with support at $3.20 on the hourly chart of the XRP/USD pair. The price is now trading below $3.220 and the 100-hourly Simple Moving Average.
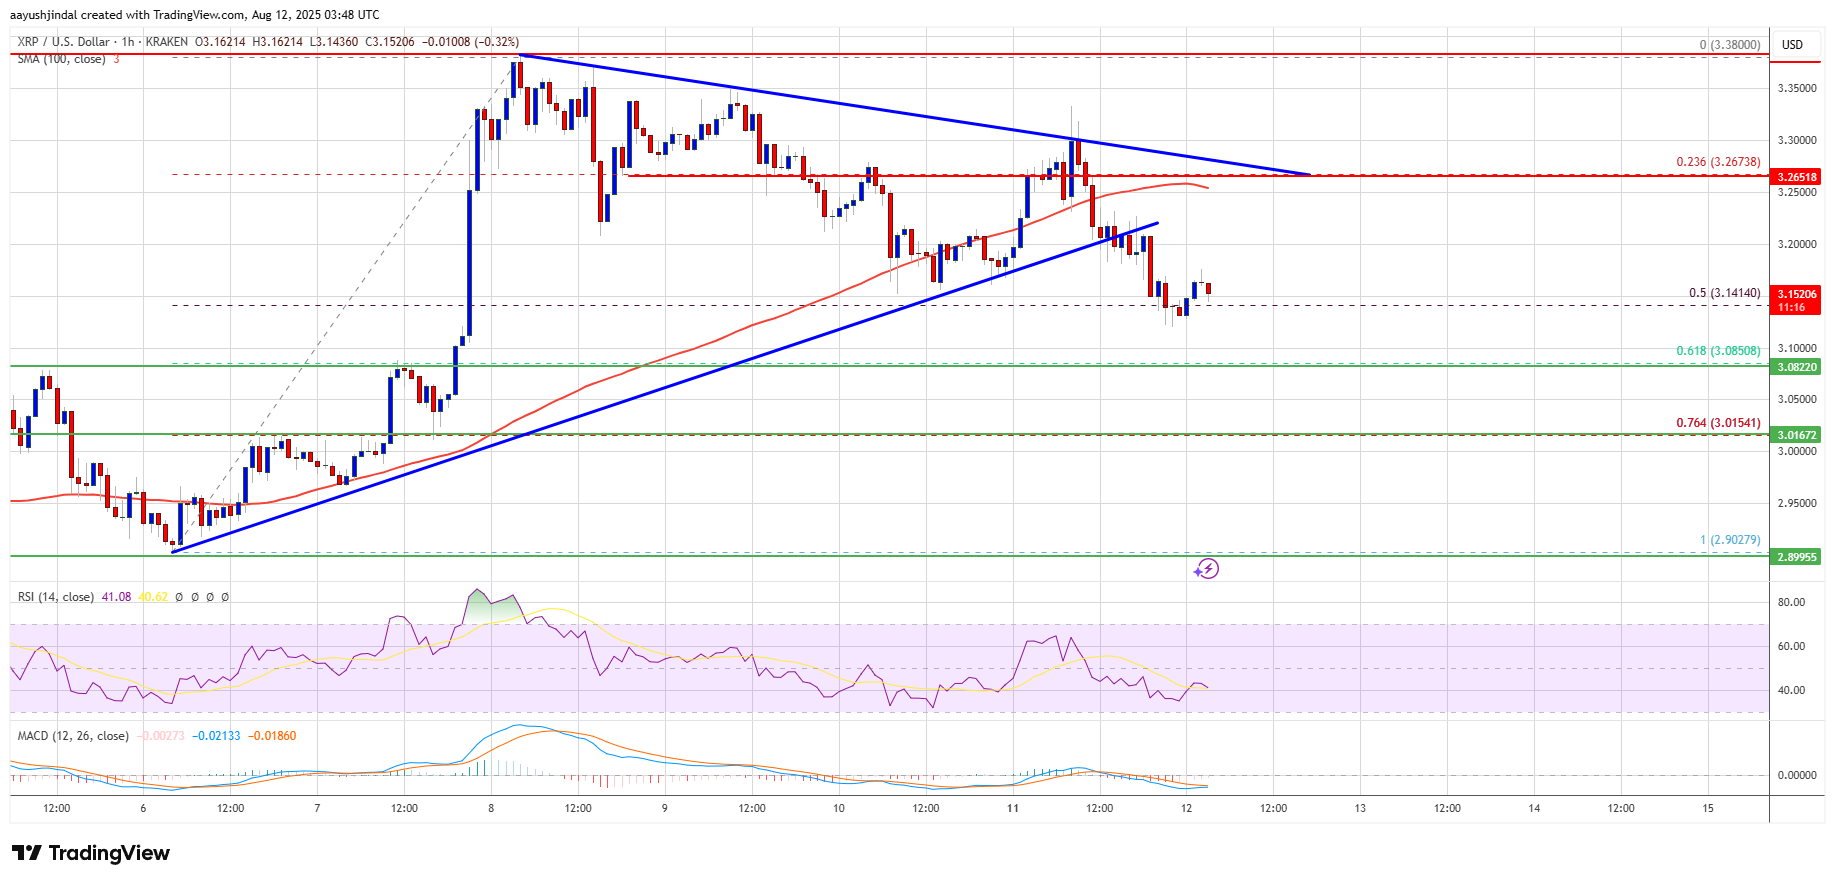
On the upside, the price might face resistance near the $3.20 level. The first major resistance is near the $3.220 level. A clear move above the $3.220 resistance might send the price toward the $3.2650 resistance. Any more gains might send the price toward the $3.320 resistance or even $3.350 in the near term. The next major hurdle for the bulls might be near the $3.450 zone.
More Losses?
If XRP fails to clear the $3.220 resistance zone, it could start a fresh decline. Initial support on the downside is near the $3.120 level. The next major support is near the $3.080 level or the 61.8% Fib retracement level of the upward move from the $2.90 swing low to the $3.380 high.
If there is a downside break and a close below the $3.080 level, the price might continue to decline toward the $3.020 support. The next major support sits near the $3.00 zone where the bulls might take a stand.
Technical Indicators
Hourly MACD – The MACD for XRP/USD is now gaining pace in the bearish zone.
Hourly RSI (Relative Strength Index) – The RSI for XRP/USD is now below the 50 level.
Major Support Levels – $3.120 and $3.080.
Major Resistance Levels – $3.220 and $3.2650.