

SUI is showing signs of stability after finding support at a key technical confluence zone, giving bulls hope for a potential rebound. However, despite the strong support structure, broader market signals continue to point toward lingering downside risks, with concerns growing that the current trend may still favor a deeper corrective move.
Holding Firm At Key Breakout Retest Zone
In the face of waning market action, crypto strategist Scient highlighted a critical juncture for SUI. After a measured pullback, the asset has successfully tested and maintained support at the Value Area High (VAH) of its previous daily trading range. This level is key, as it marks the original breakout point, signaling that bulls have successfully defended their territory.
A 12-hour breaker block acts as the catalyst for the initial breakout, which now serves as a robust defensive barrier. Adding to this validation, a dense cluster of Exponential Moving Averages (EMAs) is converging in the same area. This combination creates a powerful confluence of indicators that bolsters the case for price stability.
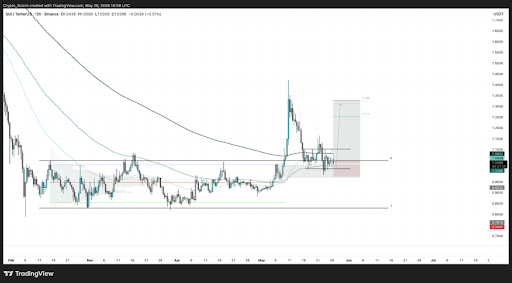
This alignment, comprising the VAH, the breaker block, and the EMA cluster, creates three distinct layers of support at a single critical price level. As long as these supports hold, the market structure remains resilient, suppressing bearish momentum and favoring consolidation.
Given this defensive posture, the path of least resistance now points upward, targeting the 0.618–0.786 Fibonacci extension zone. Should this accumulation phase continue to hold, this target remains the logical destination for the recovery.
SUI Still Struggles To Confirm A Meaningful Bottom
According to a report by MCO Global, SUI has yet to confirm a meaningful market low, raising concerns regarding the asset’s broader structural health. The prevailing technical analysis suggests that the current recovery phase may represent a completed wave 4. If this wave structure holds, the asset appears positioned to initiate a fifth wave decline, with technical targets projected in the 65-cent to 49-cent range.
On the technical front, immediate overhead resistance is concentrated within the $1.12 to $1.31 corridor. A decisive daily close above $1.31 is the essential move to improve the outlook and support an extended wave 4 recovery, with upside targets potentially reaching between $1.44 and $2.08. Failing to clear this hurdle leaves the asset exposed, with immediate downside support levels at $0.97, $0.88, and $0.81.
Ultimately, the current price action is increasingly mirroring a classic five-wave decline from the May highs. Until the market demonstrates a shift toward impulsive, high-conviction buying, the technical evidence continues to favor lower prices over an immediate structural reversal.
